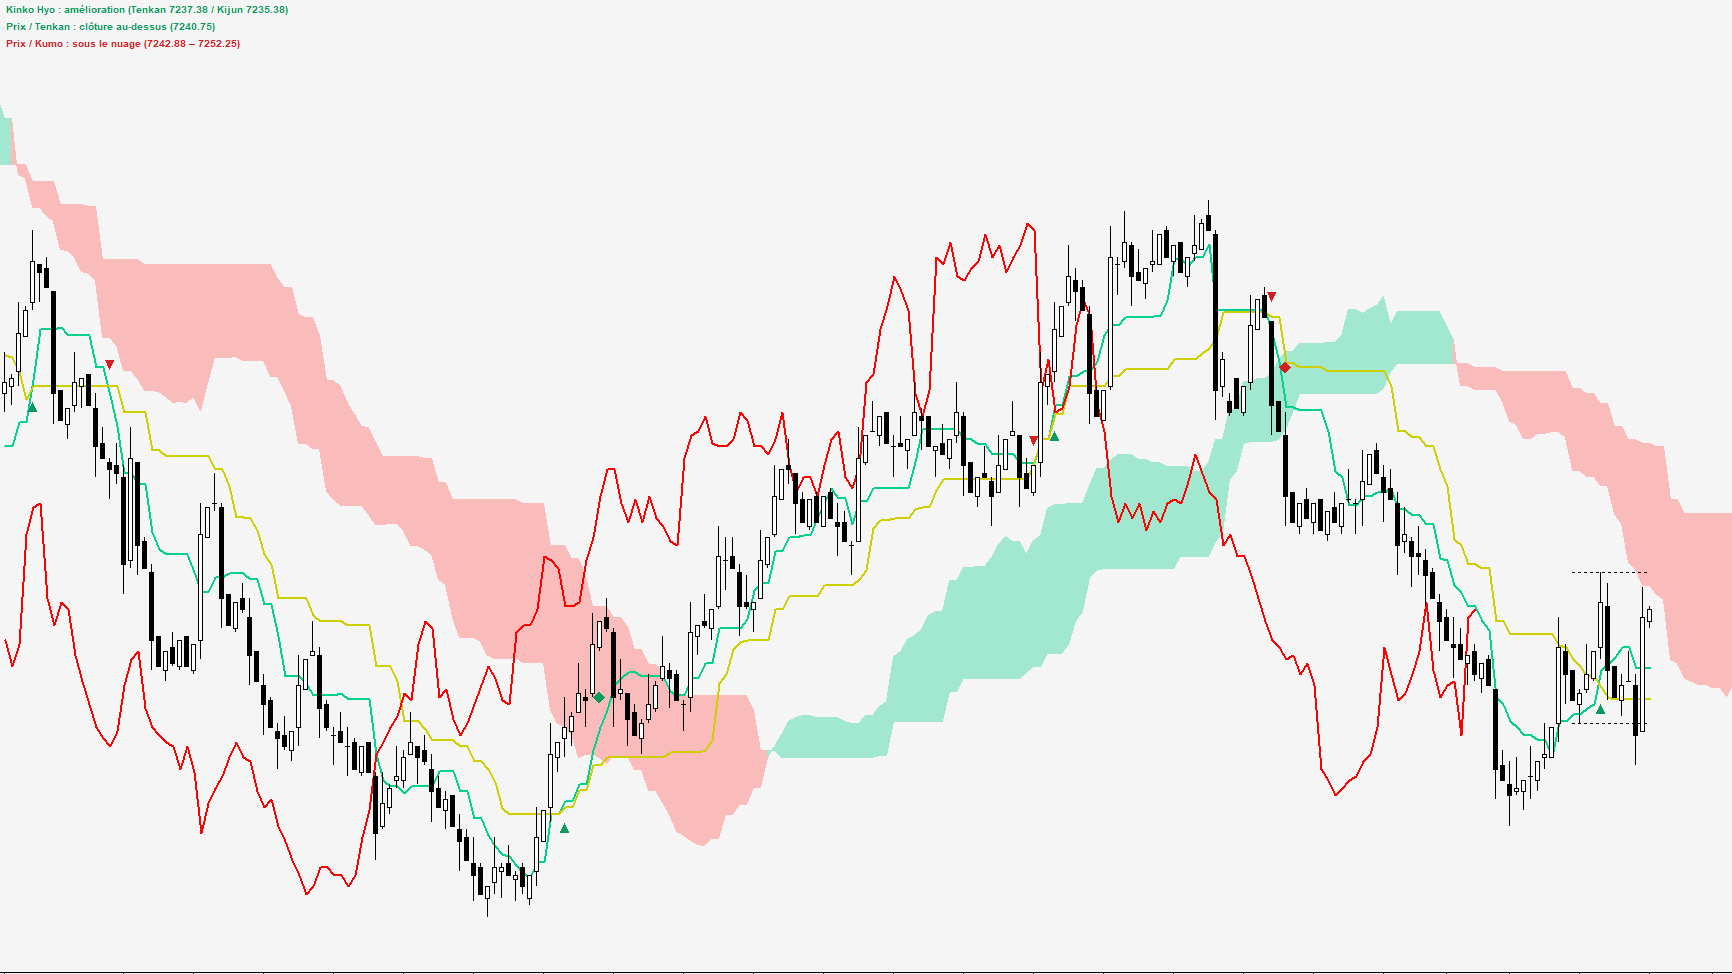
Core
Ichimoku Kinko Hyo
Tenkan, Kijun, cloud and Chikou, calculated from the very first candle. Cross markers, status panel and optional alerts.
Custom study for Sierra Chart
Lines, cloud, waves, basic numbers, Hosoda projections: every Ichimoku analysis tool in a single study, drawn for you on your Sierra Chart charts.
7 days free, no commitment · English and French · Sierra Chart subscription required, not included
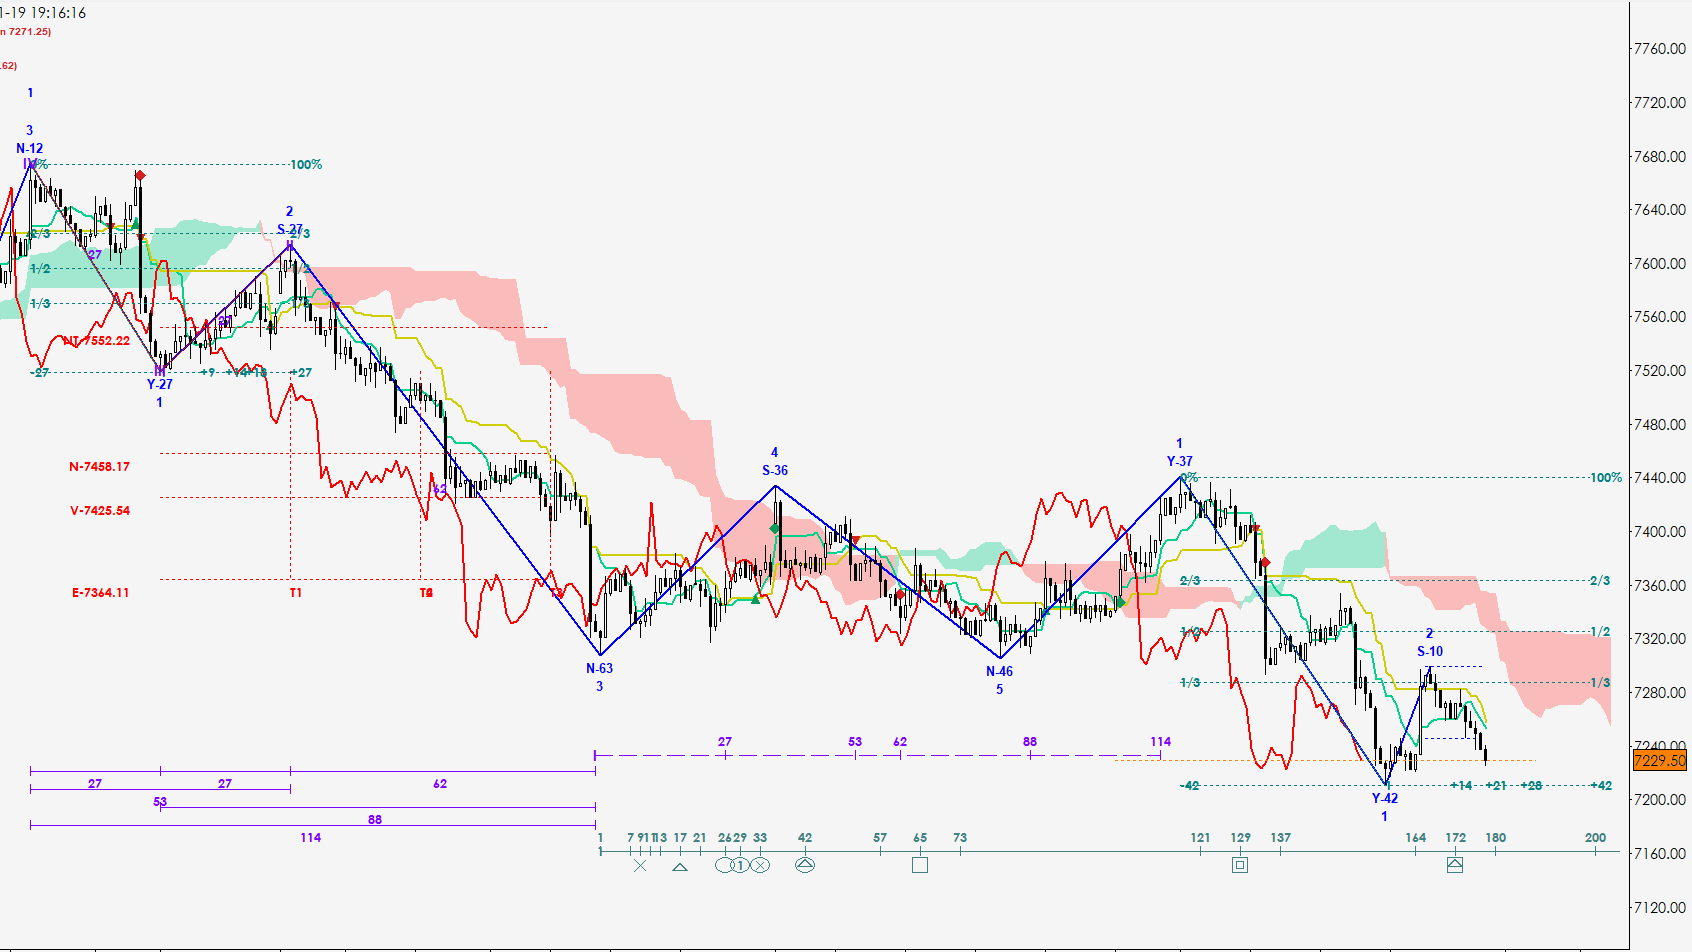
10 modules
in one study, each can be switched on or off
Automatic delivery
the DLL arrives in your Sierra Chart by itself
Updates included
for as long as your subscription is active
English · Français
choose the language in the settings
The modules
Each tool is placed with one click, moved with the mouse and recalculated automatically. Your drawings are saved and come back every time you open Sierra Chart.
Core
Tenkan, Kijun, cloud and Chikou, calculated from the very first candle. Cross markers, status panel and optional alerts.
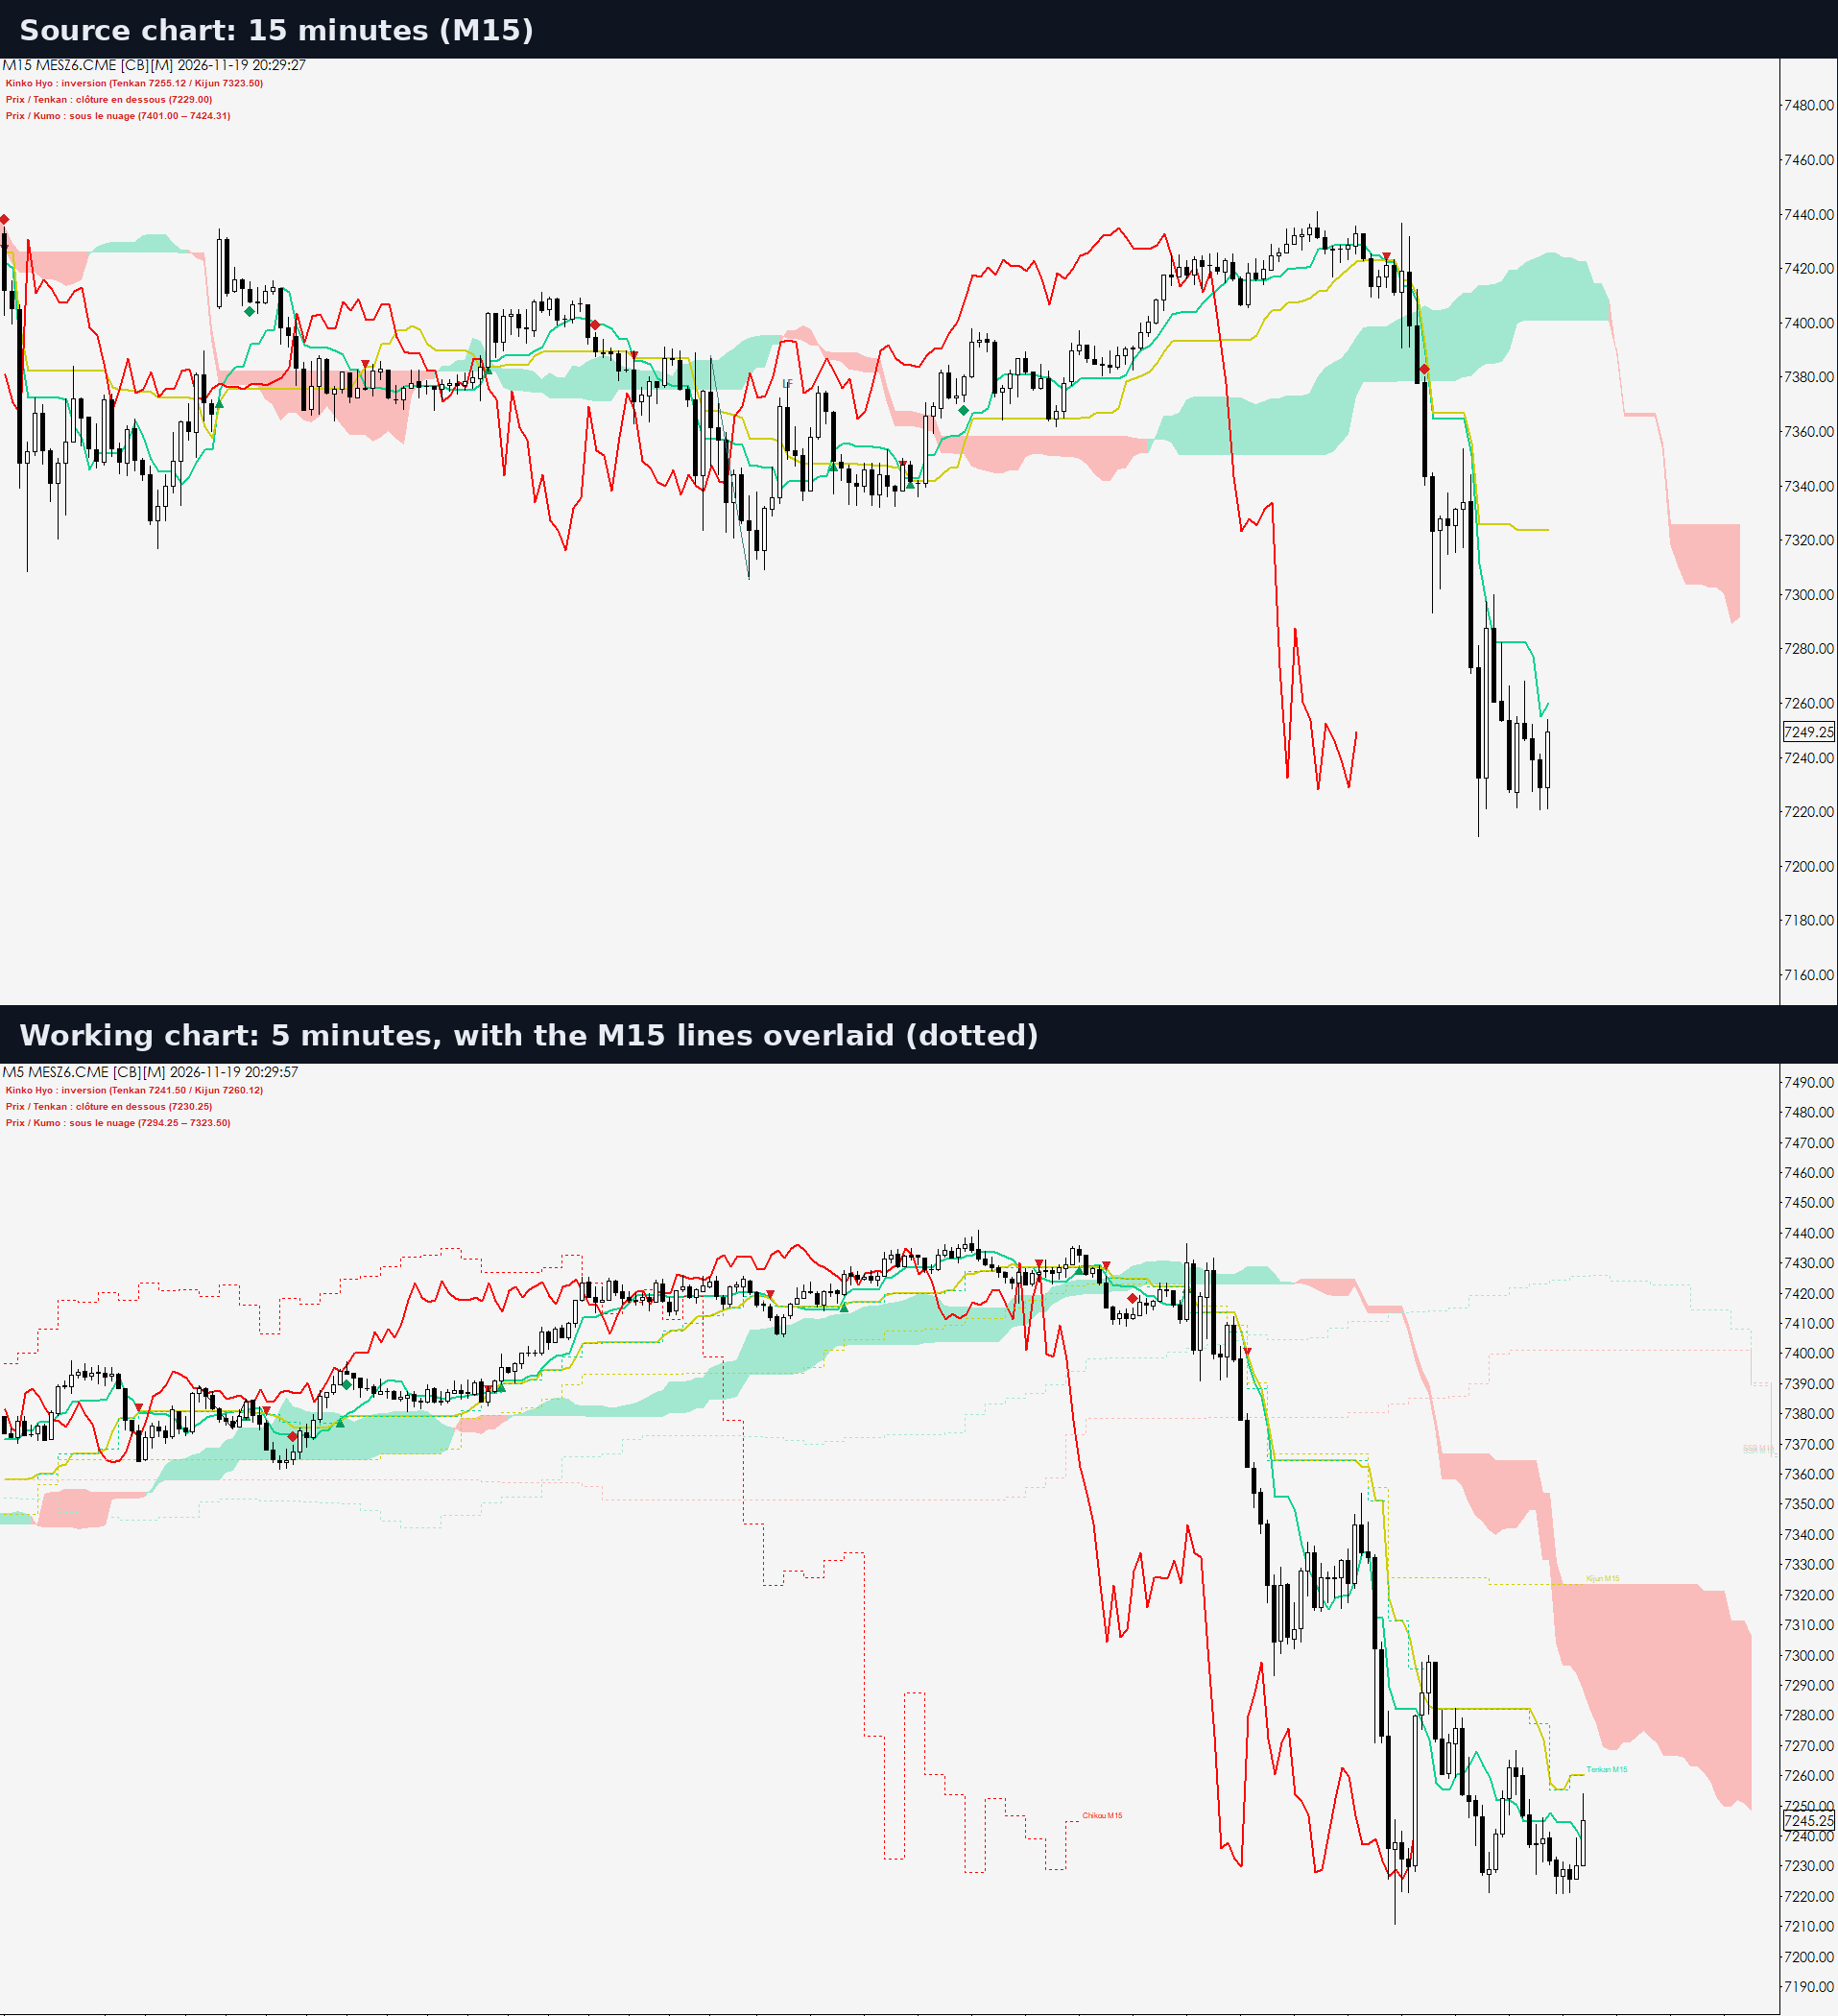
Multi-timeframe
Show the Ichimoku lines of up to three other charts on one chart, with their offsets respected.
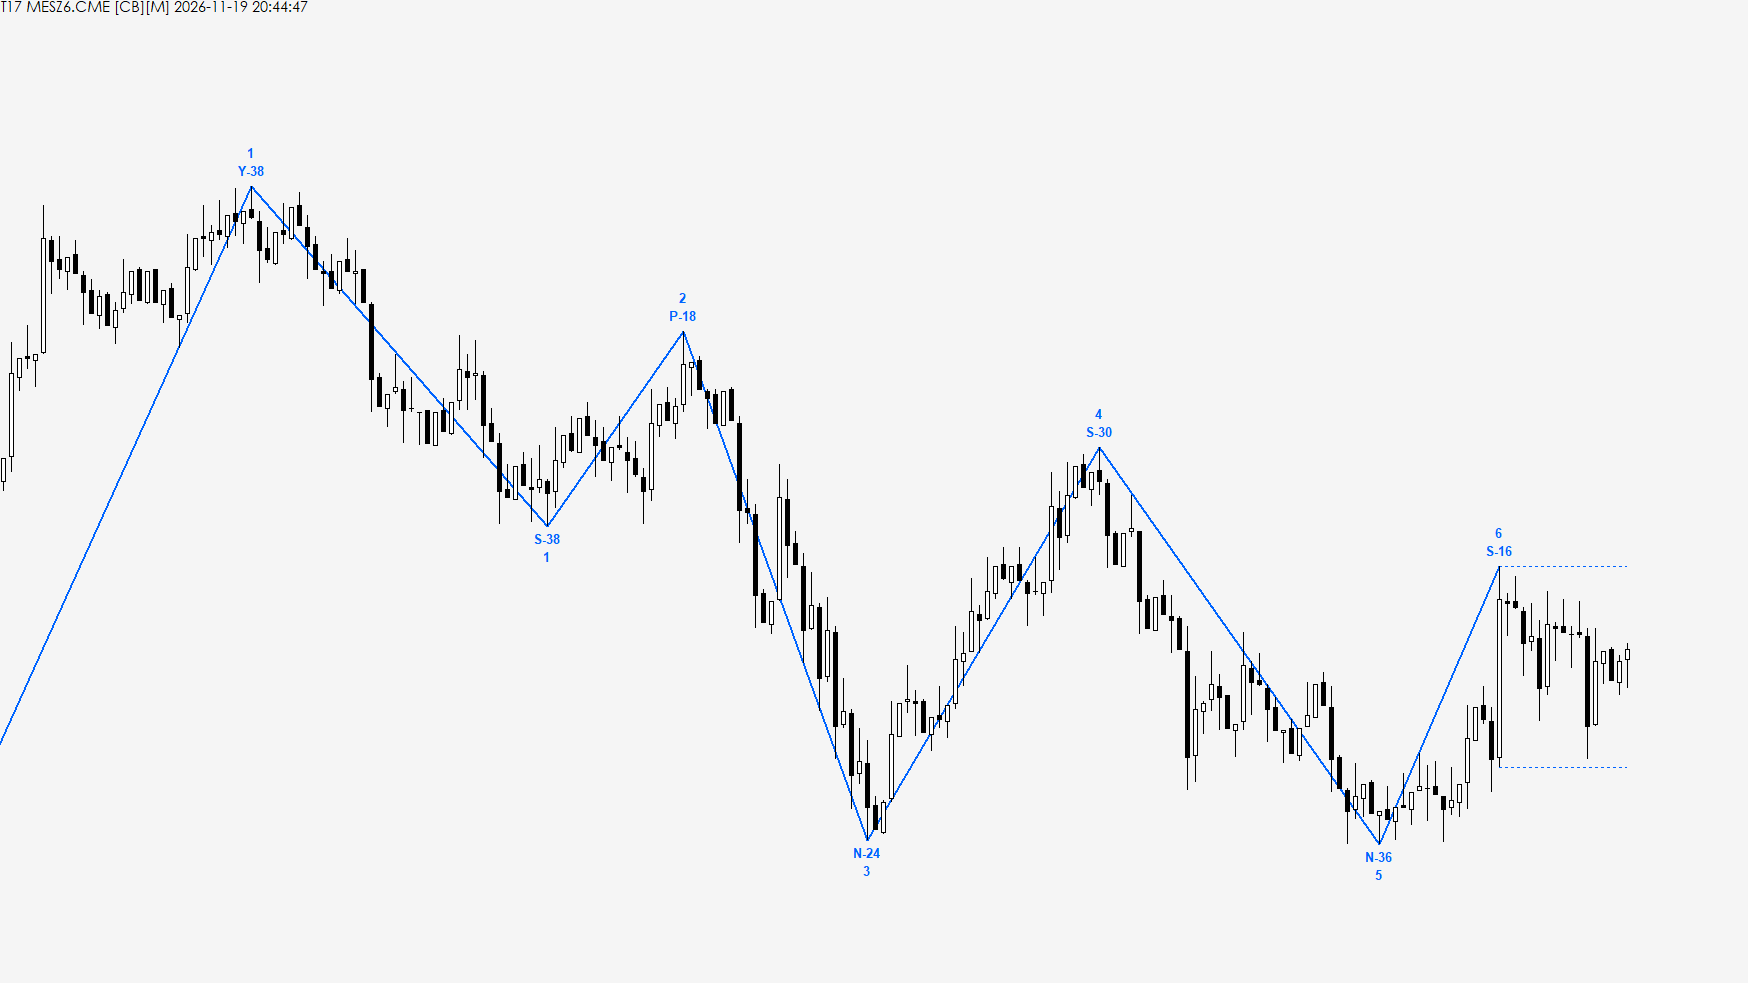
Exclusive
Waves built automatically from candle blocks, labelled N, S, P, Y, with their length and number.
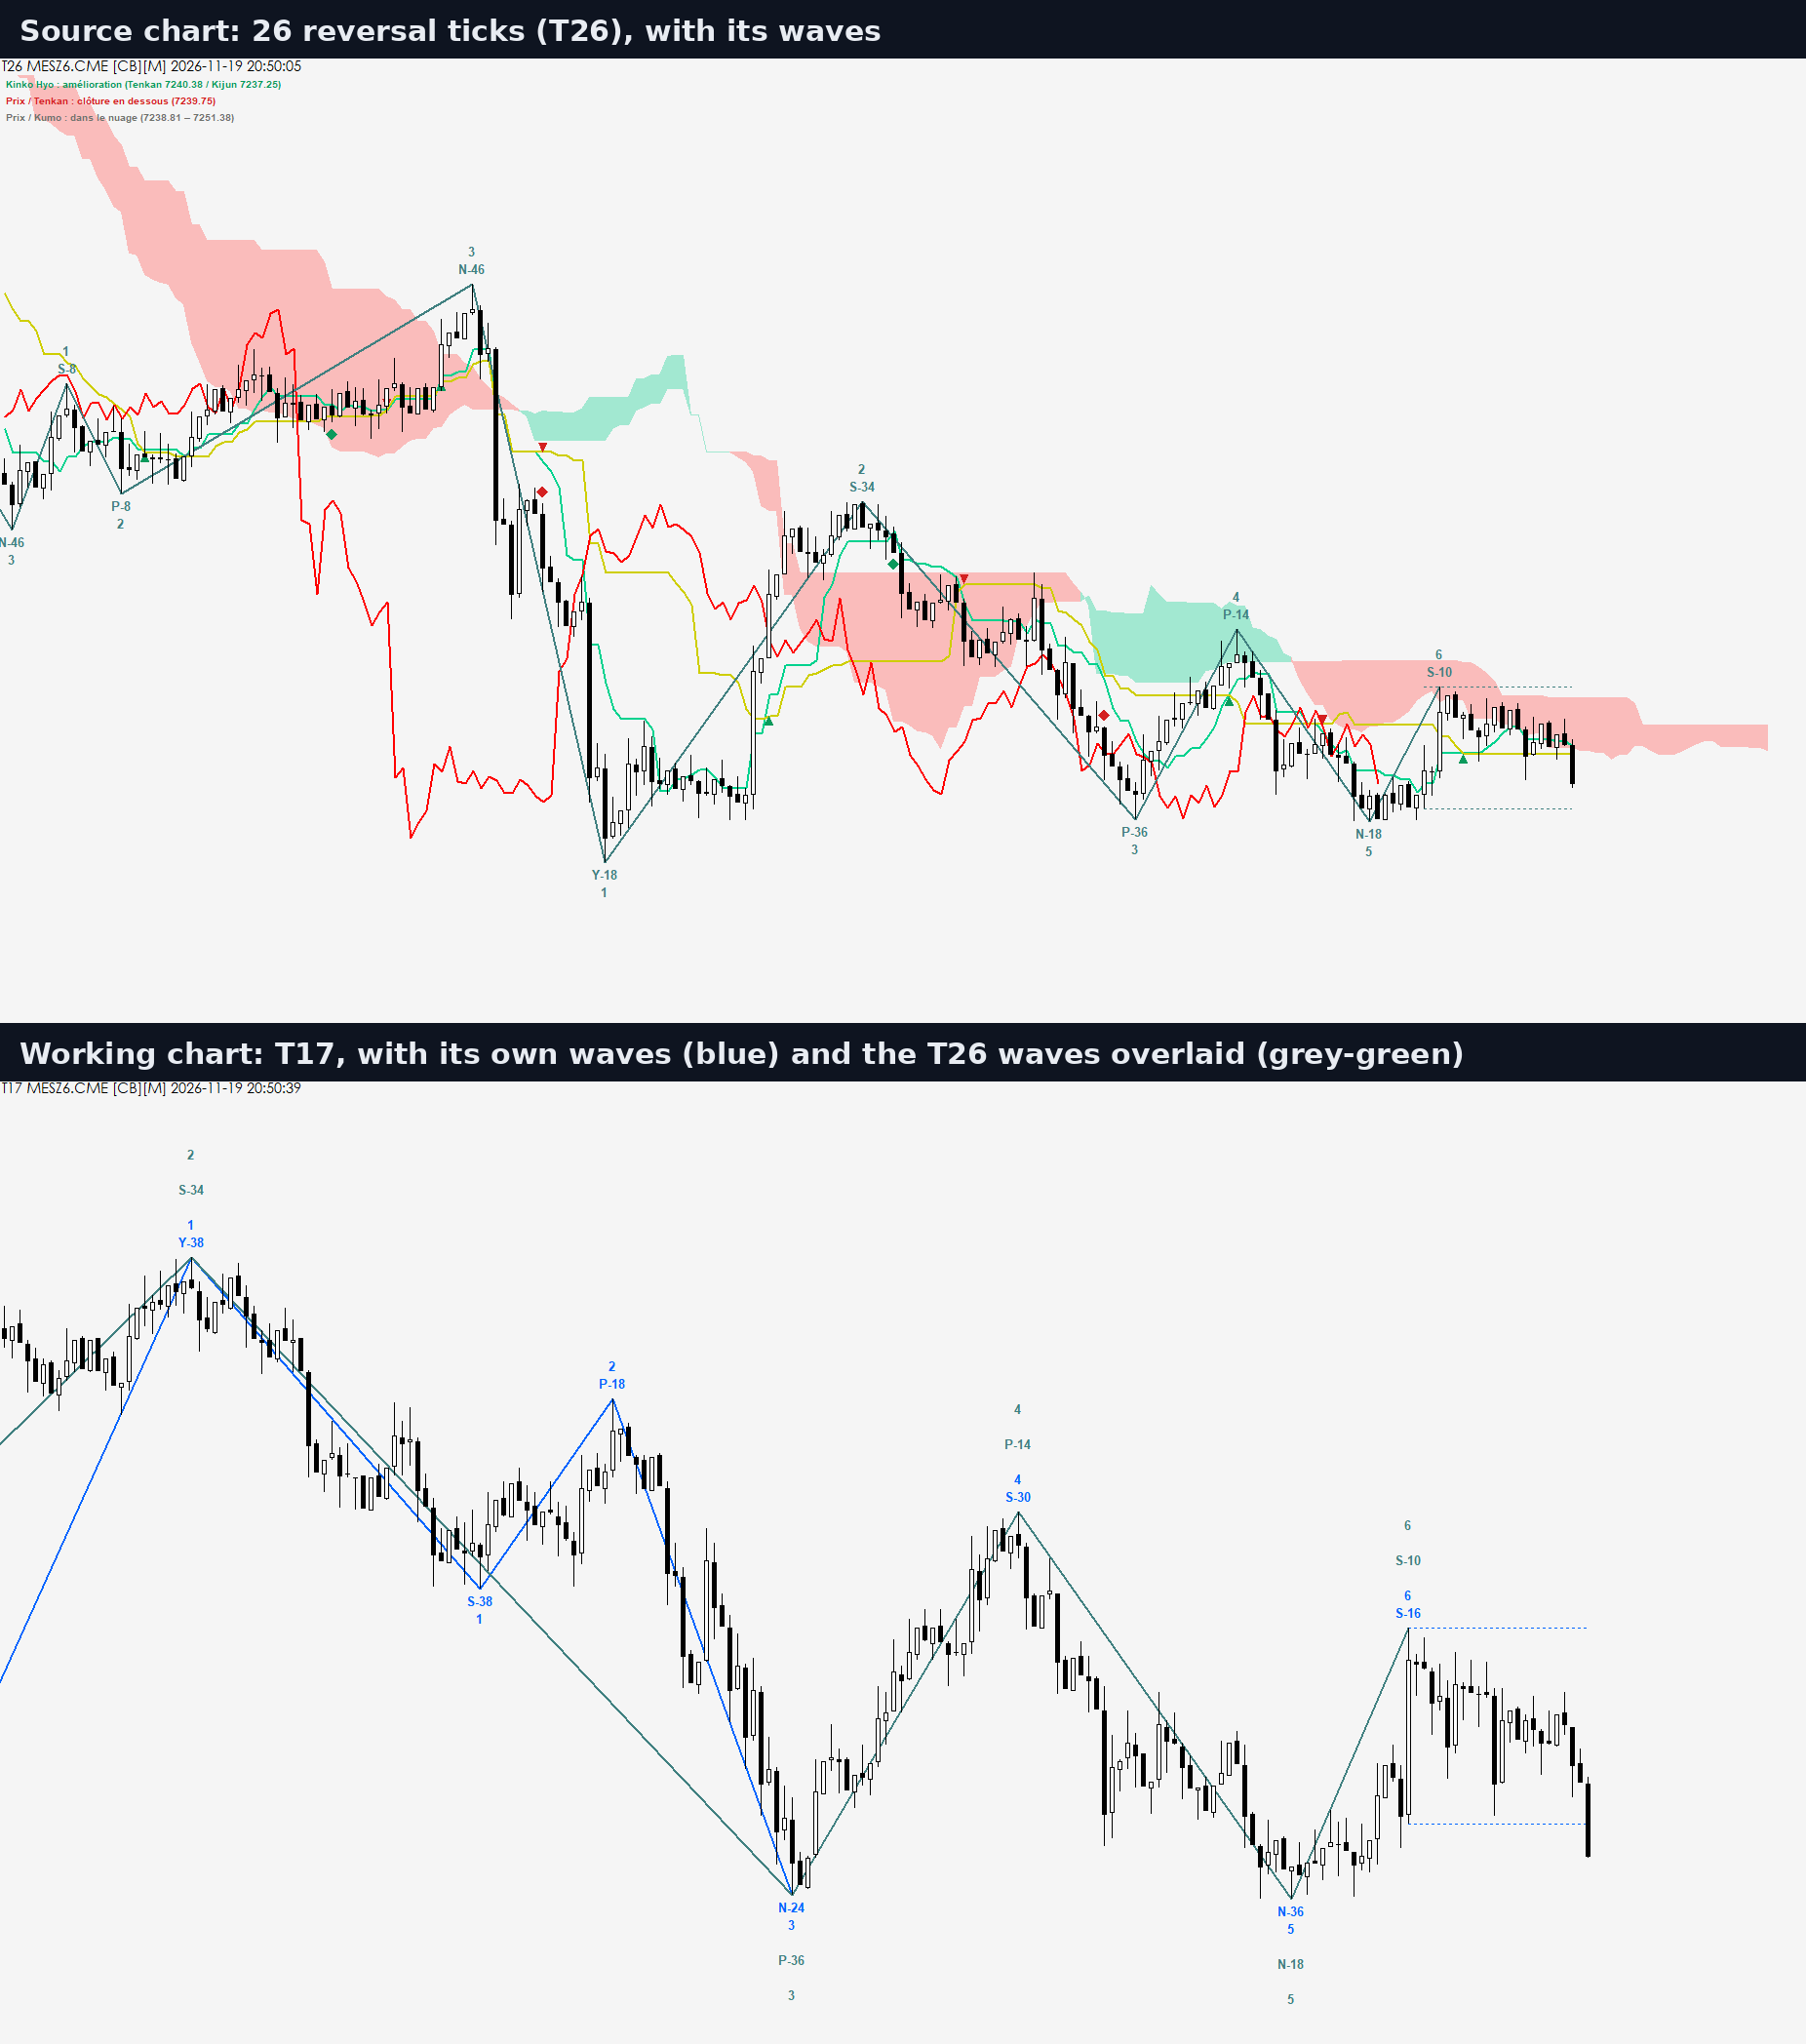
Multi-timeframe
Bring the waves of a higher timeframe onto your working chart.
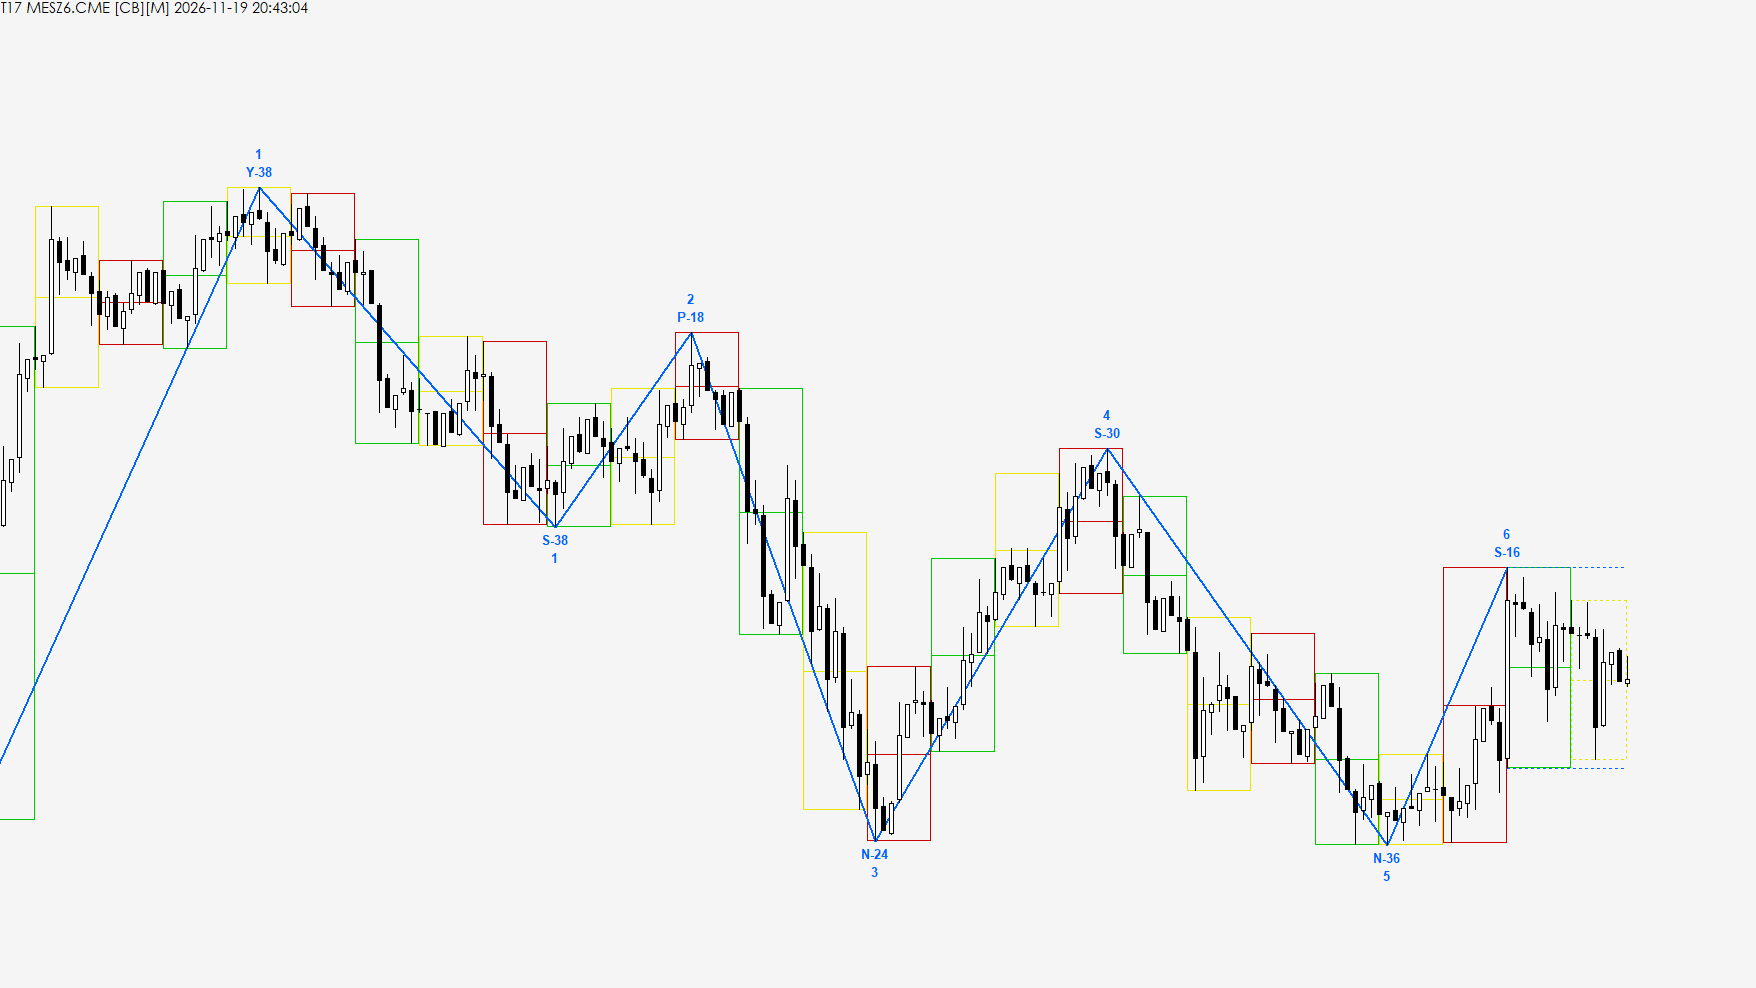
Exclusive
The block structure the waves are built on, anchored to the date of your choice.
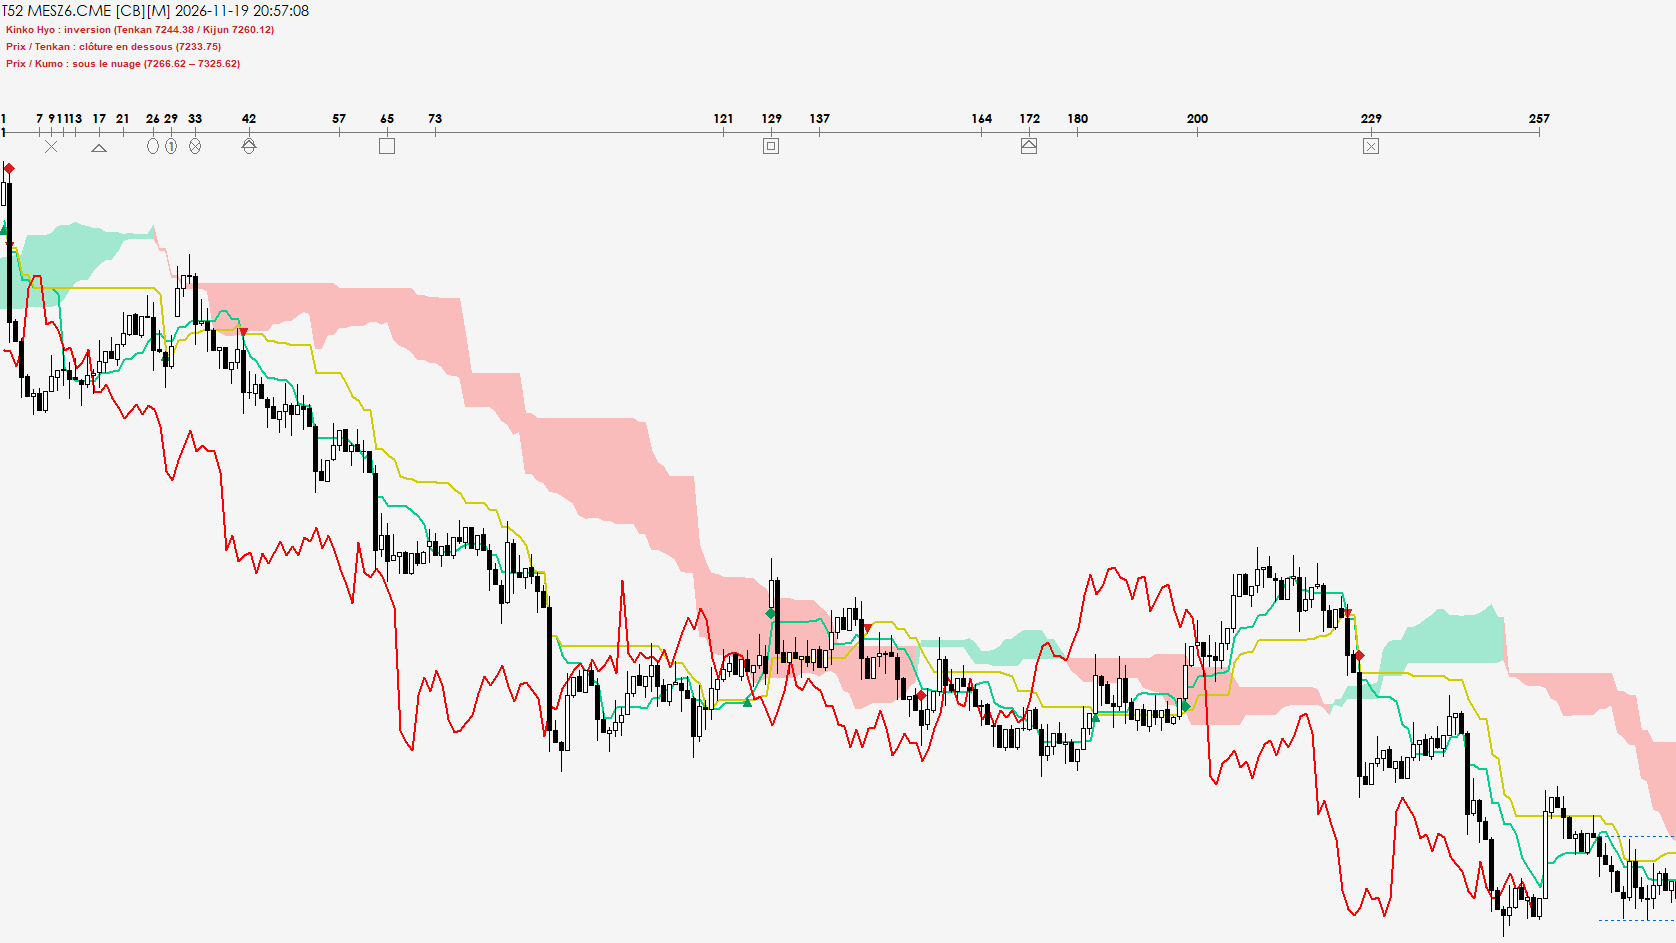
Time
A ruler of the basic numbers, with one symbol per centre and framed ranges, placed with one click.
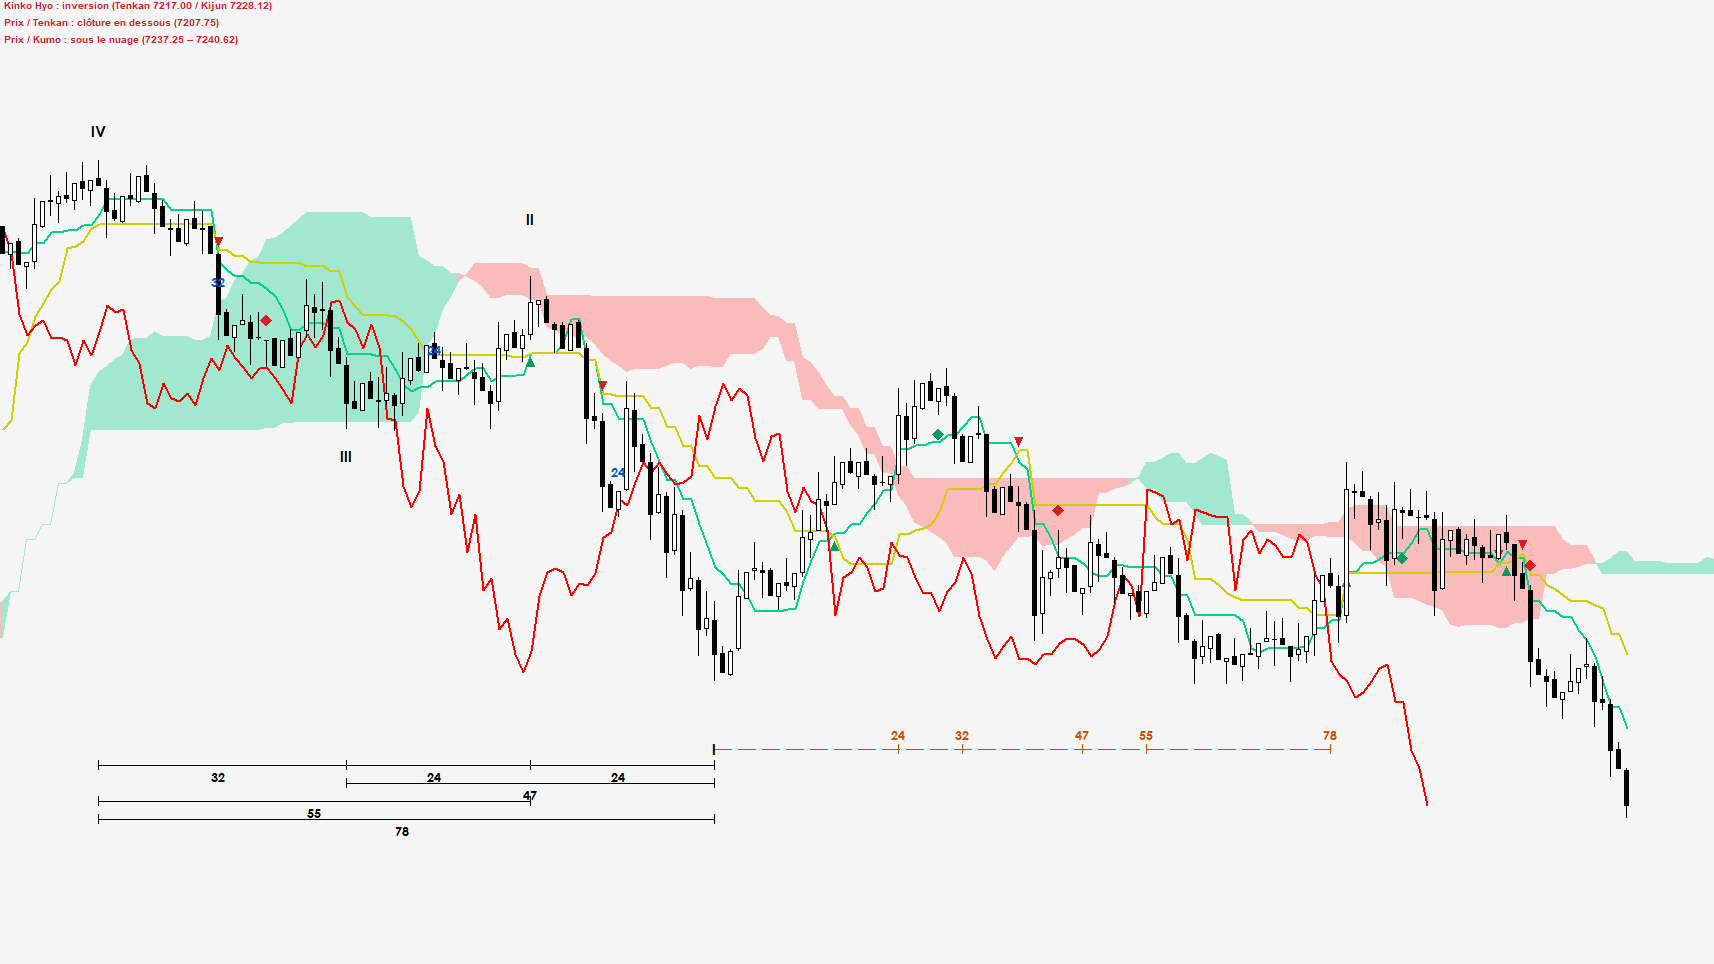
Time
Every distance between your points, shown as braces, then mirrored forward into the future.
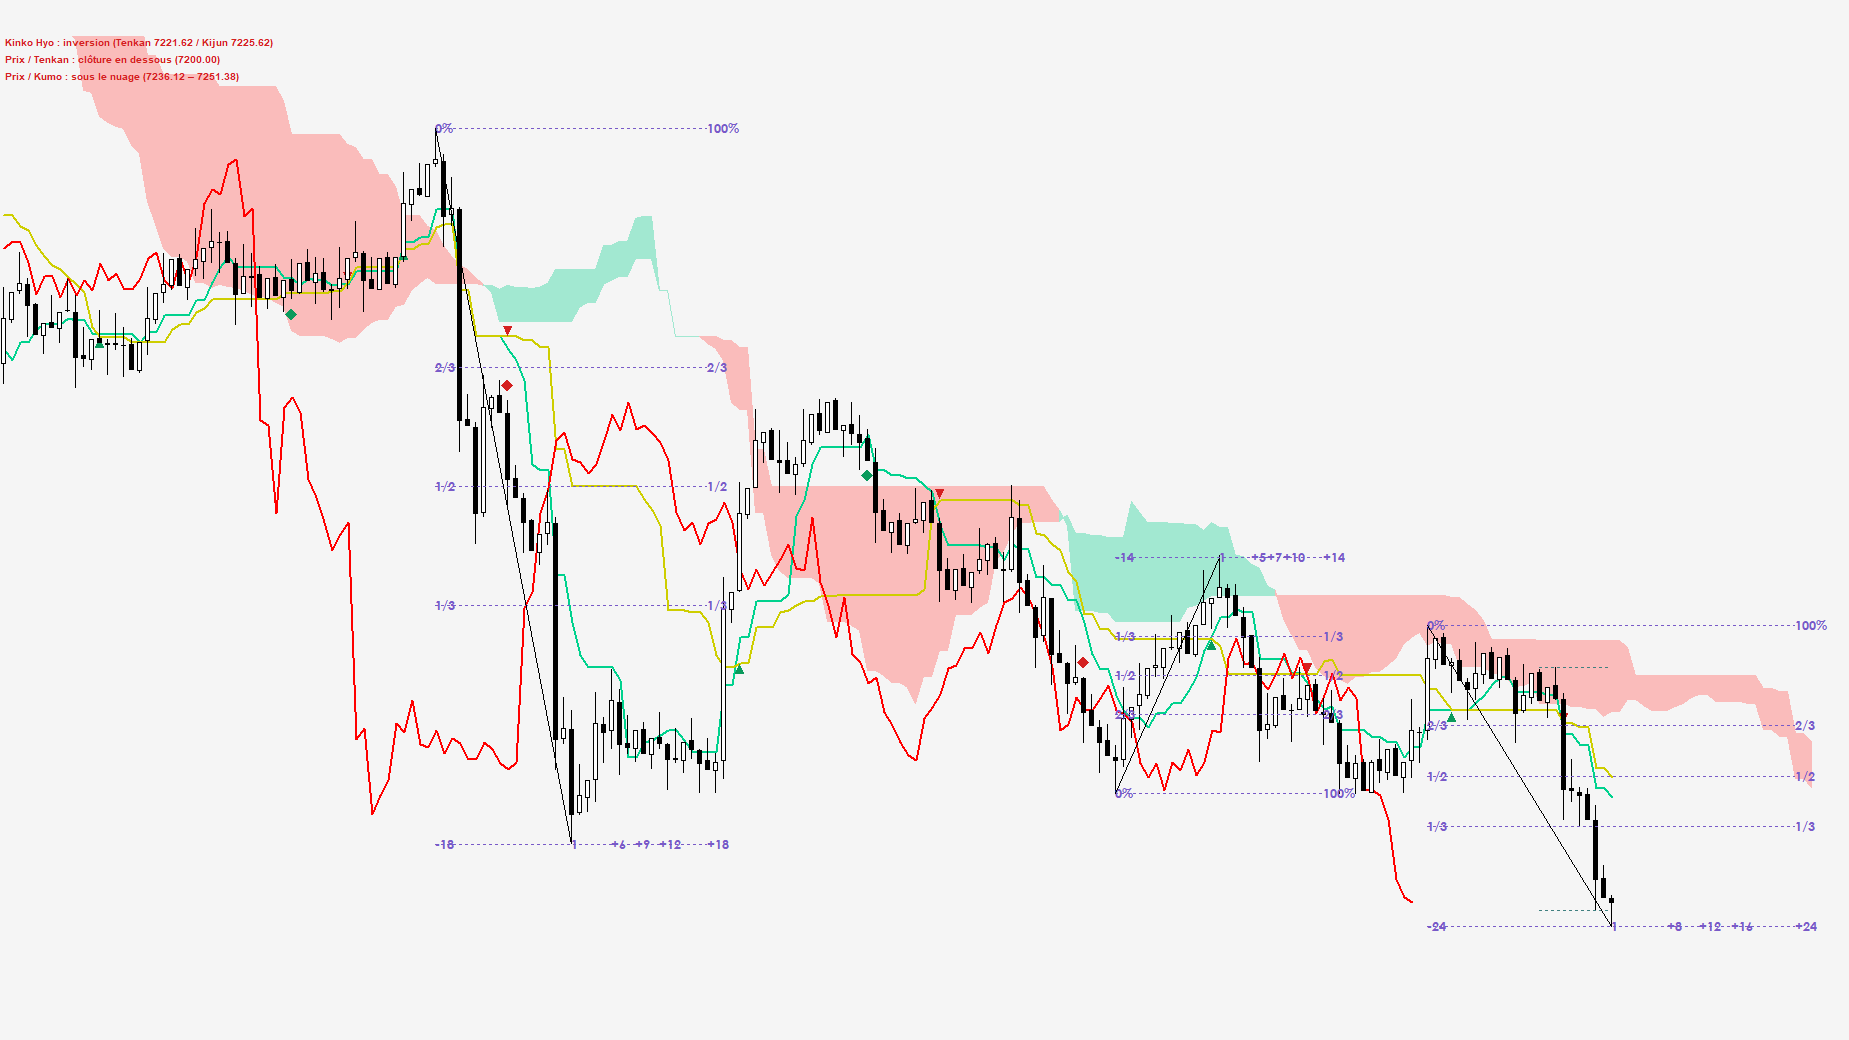
Price and time
The first impulse wave as the reference: candle-count marks and 1/3, 1/2, 2/3 retracements.
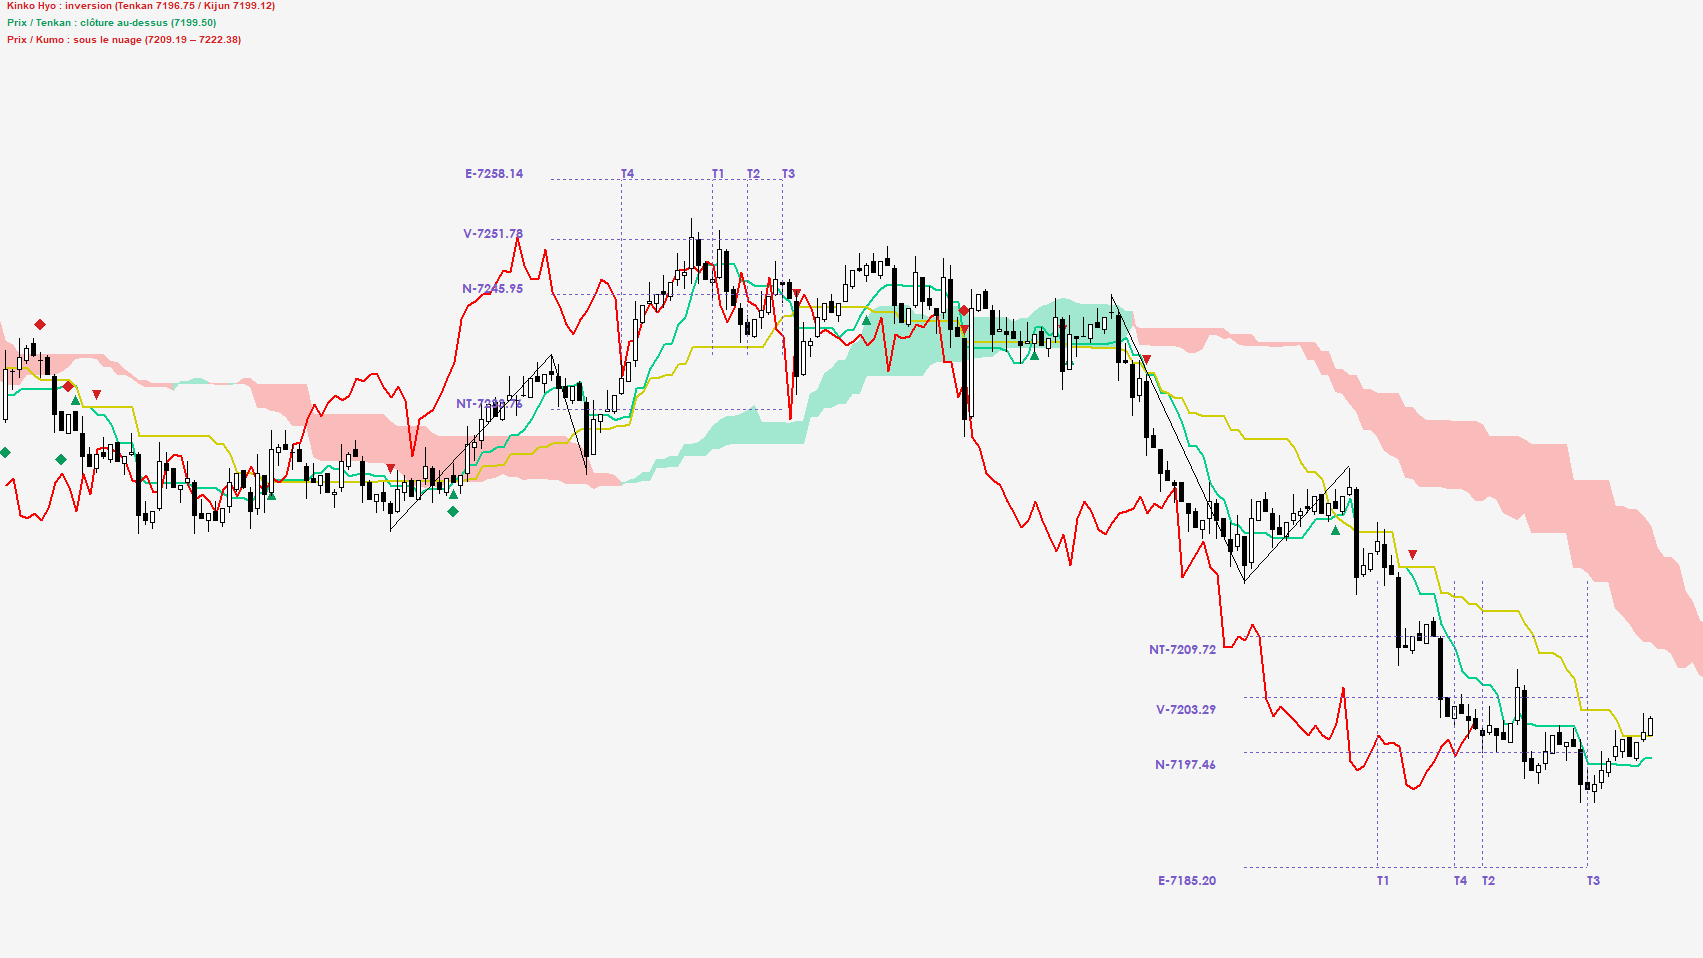
Price and time
NT, N, V, E price levels and T1 to T4 time targets from three movable points A, B, C.
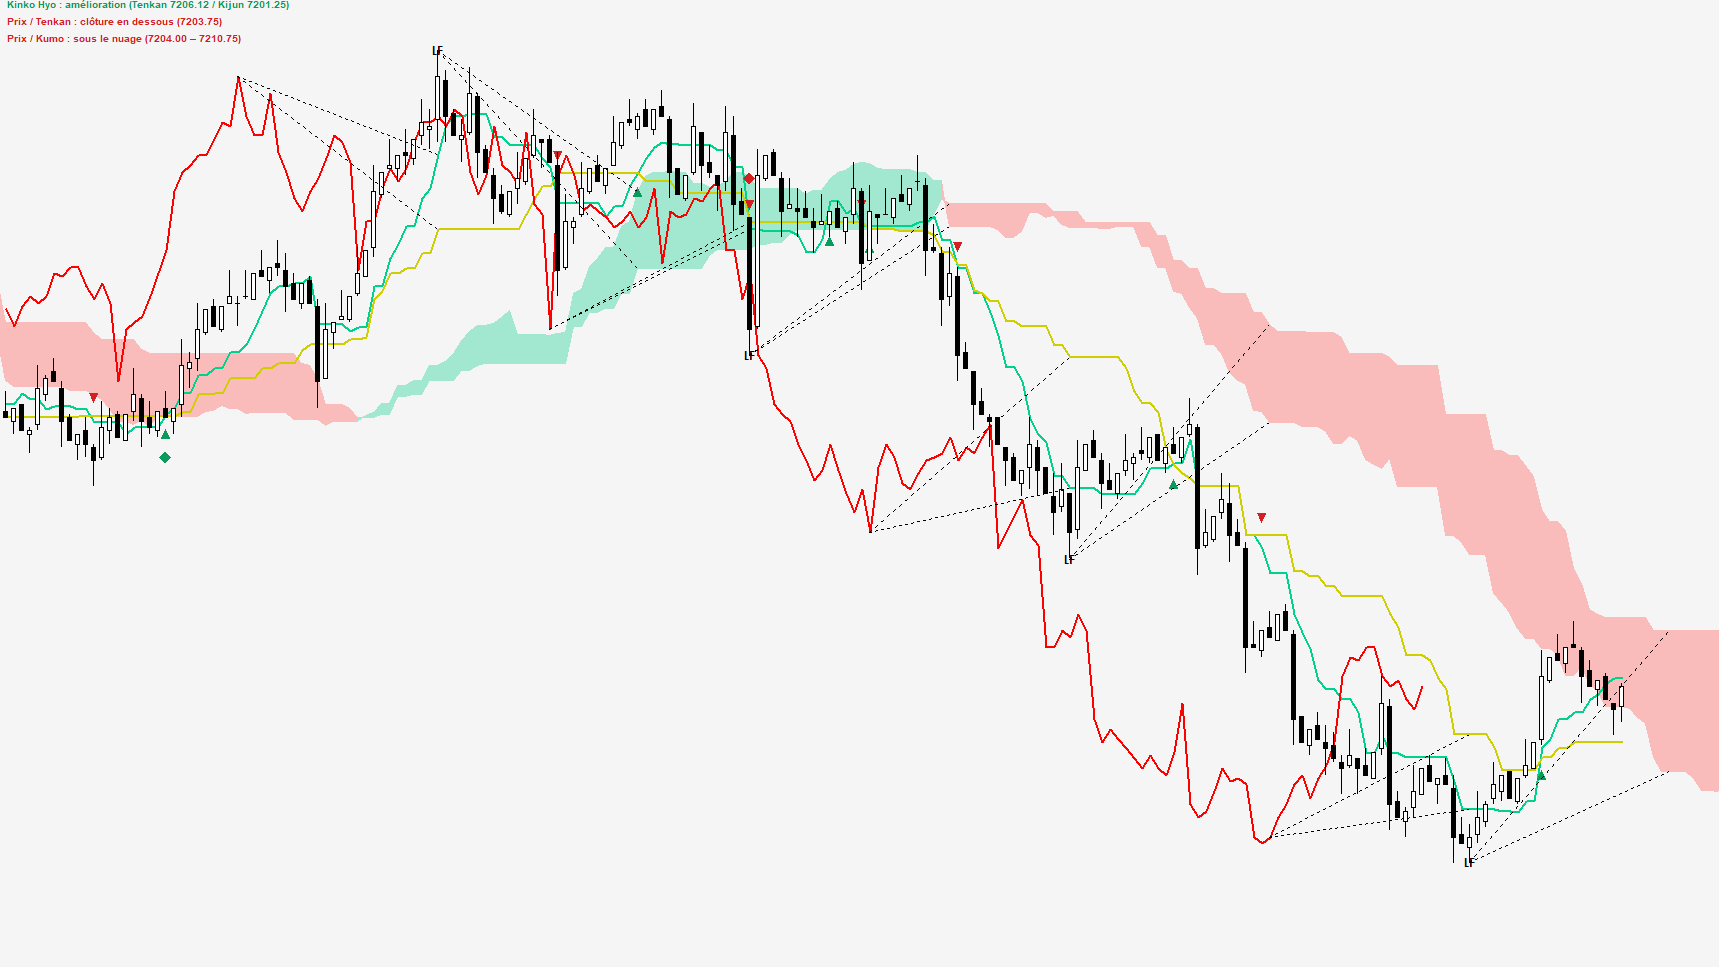
Price
Four diagonals to the cloud, Tenkan and Kijun to track price against the high.
Only at Krisarmel
The market is split into overlapping blocks of candles. A precise set of rules, applied in a fixed order, decides at each closed block whether to extend the wave or start a new one. The same chart always gives the same waves.
Each wave gets a label that says what the market is doing, and a number that follows the trend until its structure breaks.
Step 1
Enter your Sierra Chart account name (Help › About menu). No payment for 7 days.
Step 2
Your account is activated within 48 hours. The study downloads automatically.
Step 3
Analysis › Studies › “Krisarmel – Ichimoku Kinko Hyo Toolkit”. Switch on the modules you need. Installation guide
Pricing
Launch price: it stays yours for as long as your subscription stays active. Cancel at any time; it takes effect at the end of the paid period.
€290 / year
Prices include VAT. Requires an active Sierra Chart subscription that allows custom studies (not included).
No. You need an active Sierra Chart subscription with a service level that allows custom studies. If your Sierra Chart subscription expires, the study stops working.
Through Sierra Chart's file distribution: once your account is activated, the DLL downloads by itself at startup, updates included.
Access is tied to your Sierra Chart account, not to a computer, so it follows your account within the limits set by Sierra Chart.
At any time, from your customer area or by email. Access stays open until the end of the paid period.
They stay on your charts. The calculations come back as soon as you subscribe again.
No. It shows observations and levels. Trading decisions remain yours.
7 days, every module, no commitment. If the tool isn't for you, it simply stops.
Start your free trial